From the News Room
Release of TNTgis 2018 17 January 2018
The 2018 Release Version of the TNTgis software family (TNTmips, TNTedit, and TNTview) is now available.
New Features
Download the new Release Version today!
Rig Camera Alignment & Exposure Balancing — TNTmips Pro 2018 2 January 2017
Automatic multi-band alignment and exposure balancing is available for imagery taken with a multi-camera rig system.
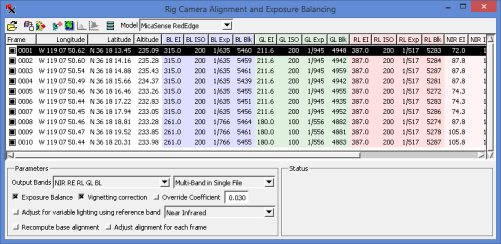
The Rig Camera Alignment & Exposure Balancing process
Try it now with the sample data provided here:
New Feature List 18 December 2017
Here's a list of new features and enhancements currently available in the Development Version of TNTgis 2018.
TNTgis 2018 is scheduled for release on 17 January 2018. If you are interested in upgrading to version 2018 and have not already received a price quote from MicroImages or one of our Authorized Resellers please contact us and one will be sent to you.
Load up to 32 Rasters in Image Band Correlation — TNTmips Pro 2018 15 Nov 2017
The number of input bands is limited by the number of graphs you can reasonable display in one window. If you select 32 input rasters it results in 496 correlation scatterplots. While displaying so many graphs at once means they will be small, depending on the window size you can still see the general shape of each scatterplot. The standard tools can also help you get the details and information you want:
- Use cursor tracking in the View to highlight corresponding raster cell values in each plot
- Place cursor over a point in one of the plots and zoom in - all plots will zoom in
- Place cursor over the graph data to see raster names, cell values, and cell counts
- Use Line tool as usual to get equation of the line
- The Highlight within Range tool can be used but it is more difficult with small graphs
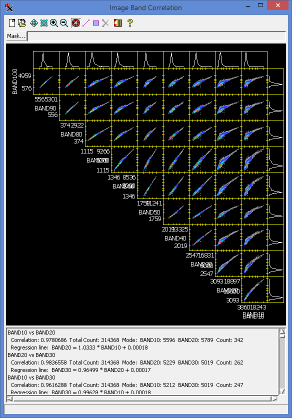
45 scatterplots showing correlation information for 10 image bands.
Overview: the Image Band Correlation window shows a scatterplot for all possible pairings of input bands from different sensors and/or dates. Raster cell values from both bands are plotted. The scatterplot thereby accentuates the cell value pairs that most often occur together in the two images. This window is commonly opened via a raster's right-mouse-button menu in the Display Manager, which prompts you to select the input rasters.
Tip: open the Image Band Correlation window via the icon in the Progressive Transformation process to automatically load up to 32 input rasters. This process also lets you display and compare all the histograms at once.
Georeference - Datum Transformation Supplemental Files 23 Oct 2017
A number of grid-based datum transformations have been added and are available via a supplemental installer. The Supplemental Datum Transformations installation contains grid shift files (.gsb), which contain information for a datum transformation – for instance between a local datum and WGS84. Grid shift files may be provided by a government or business and may be open source, private, or available for purchase. If you have open source .gsb files for your area of interest, we can add them to the supplemental installation.
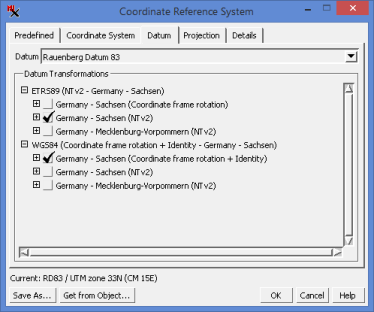
The NTv2 transformations between Rauenberg Datum 83
and ETRS89 are provided via supplemental .gsb files.
Note, there is no need to download and install the supplemental grid transformations unless you need them. All transformations for supported datums are listed for selection in the Datum tab of the Coordinate Reference System window including supplemental transformations. If you select a transformation that is available but not installed, a message will appear indicating where to download the optional transformation files.
Raster Thresholding - Otsu's Method for Raster Binarization — TNTmips Pro 2018 6 Sept 2017
Otsu's method automatically computes the optimum global threshold using the raster histogram. It is meant to be used on bimodal images (i.e. having two histogram peaks). The optimum threshold value is dependent on peak separation, noise, size of objects and background, as well as illumination and reflectance uniformity. The threshold value from Otsu's method is often better than a manual estimate found from looking at the histogram.
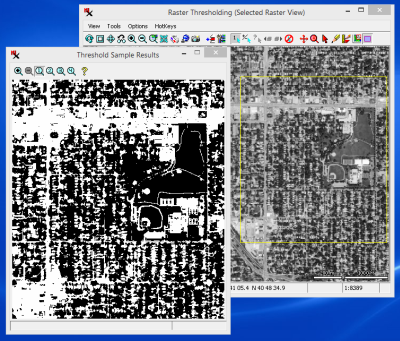
Raster Thresholding (Image > Convert Raster > Thresholding) - Results using Otsu's method.
Tip: open Preview and View windows by selecting the image name in the raster list.
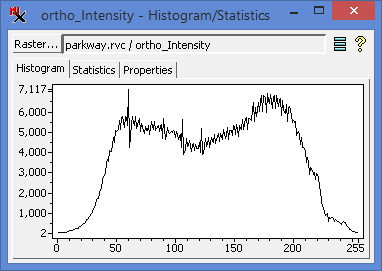
Bimodal histogram for above input raster with shallow valley
between peaks.
Images with distinct foreground objects and
background are likely to have a more distinct valley.
Create Custom Icons for TNTsdk-Based Applications — TNTmips Pro 2018 18 Aug 2017
The Edit TNTsdk Developer Icons process (Tools > Developer > Edit TNTsdk Developer Icons) lets you design your own icons and buttons for the user interface controls in your custom TNTsdk applications.
The Bitmap Symbol Editor opens when you Add or Edit icons in your icon file. When adding new icons you can start with an existing symbol pattern and edit it or create your own from scratch. The icons you add are referenced by your program in the same way as those provided by MicroImages.
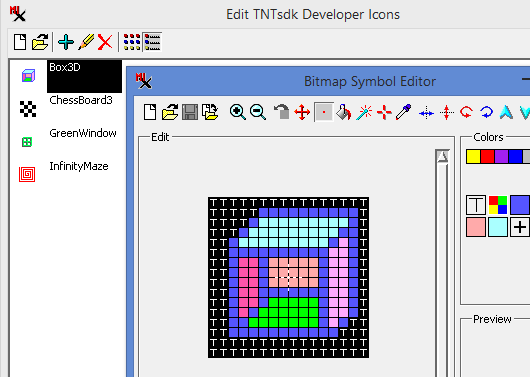
Edit TNTsdk Developer Icons
Populate Lookup Table in Reassign Cell Values — TNTmips Pro 2018 4 Aug 2017
The Reassign Image Cell Values process (Image > Classify > Reassign Image Cell Values) uses a lookup table that maps what output value a raster cell gets based on its input value. While each lookup operation can be entered manually, it does take some time.
Instead, you can quickly and easily create a lookup table with the Populate Lookup Table icon  . After selecting your input raster(s), simply click the Populate Lookup Table icon and specify either Input Interval or Number of Intervals. If desired, manually edit the table to fine tune any lookup operation.
The Populate Lookup Table feature works with all methods that use a lookup table — Reassign by: Value (one output per input value), Threshold (Minimum value defined, maximum derived from next rule), and Range (both Minimum and Maximum defined).
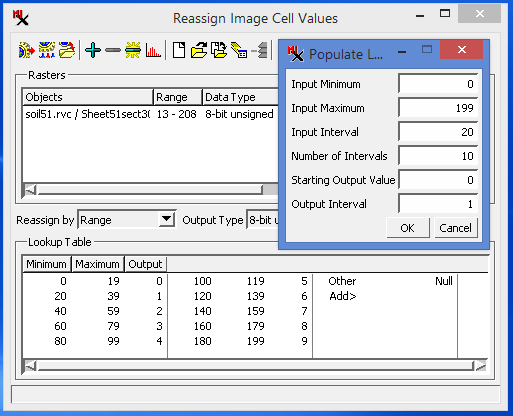
Reassign by Range using Populate Lookup Table Icon
Auto-raise Layer in View Window - TNTmips Pro 2018 21 July 2017
The Legend in the View window sidebar gives you a way to temporarily display a layer above all the other layers in the View.
Often when working with multiple layers in one View you want to look at a layer positioned underneath another. It can be cumbersome to raise and lower the layer of interest or repeatedly turn on and off the Show/Hide layer toggles.
Instead, hover your mouse over any layer name in the sidebar Legend. You will see a datatip near your cursor showing file path and description. At the same time the View window changes to show that layer on top. Any transparency for that layer is also temporarily turned off. When you move the mouse away from the layer name the View returns to normal.
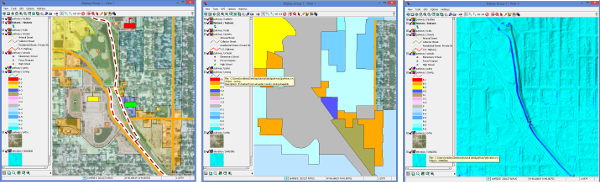
Normal display — Polygon layer brought to top — Shading raster on top
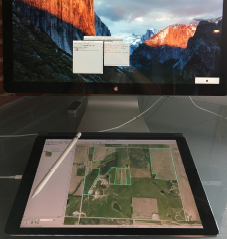
TNTmips' Spatial Data Editor:
Digitizing on an iPad Pro
Editor - Use iPad Pro as a Digitizer 28 June 2017
A useful App called duet lets you extend your computer's desktop to an iPad Pro giving you a way to digitize in the Spatial Data Editor using an iPad and the Apple Pencil.
To set up the duet App, purchase (US$19.99) and install it on an iPad Pro and then download and install a free copy of duet on your Mac or PC. Start duet on your computer, connect to your iPad with a USB cable (the one used for charging the iPad), and duet will automatically detect the iPad. Detailed installation instructions include how to adjust your display settings.
After setting up duet, you are ready to digitize in the Editor with your iPad. Simply drag the Editor's View window to the iPad and use the Pencil to directly trace or edit layers on the iPad's screen.
For best results, it is recommended that the system does not "sleep" while the connection is active.
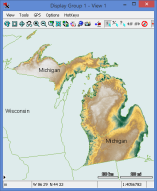
Polygons for the state of Michigan are combined to extract one raster for the state.
Raster Extract — Combine Polygons by Attribute 31 March 2017
The Raster Extract process now has a 'Combine by Attribute' toggle for the 'By Polygons' mode. This gives you the ability to treat multiple polygons with identical attributes as one region resulting in one output raster for each unique attribute. With the toggle off, separate rasters are created for each polygon.
All elements with blank or no attribute assigned will be combined as a single region. Attributes are matched by string value not by record, so different records sharing the same attribute value will be combined to form one region.
Welcome Geocomp International! 16 February 2017
MicroImages would like to welcome Geocomp International of Australia as an authorized Reseller of TNTgis software. Geocomp International is an inovative spatial data acquisition and consulting company that supplies specialized services to a range of industries requiring up to date spatial solutions for their projects.
Release of TNTgis 2017 26 January 2017
The 2017 Release Version of the TNTgis software family (TNTmips, TNTedit, and TNTview) is now available.
New Features
Download the new Release Version today!
New Feature List 7 December 2016
Here's a list of new features and enhancements currently available in the Development Version of TNTgis 2017.
TNTgis 2017 is scheduled for release on 18 January 2017. If you are interested in upgrading to version 2017 and have not already received a price quote from MicroImages or one of our Authorized Resellers please contact us and one will be sent to you.

Welcome Exa! 16 February 2017
MicroImages would like to welcome Exa Ltda. (formerly GeoMine) of Chile as an authorized Reseller of TNTgis software. Exa is a consulting services company with a team of specialists and experts who have extensive experience in the mining business at all stages.
GISGeography.com lists 1000 GIS Applications 16 June 2016
What can GIS really do? Take a look at the article on the GIS Geography web site to learn about 1000 GIS Applications in over 50 industries. TNTgis software is featured for uses in agriculture, transportation networks and LiDAR processing.
Moving to the Cloud! 23 February 2016
MicroImages' web site and services are moving to the cloud! Some web services may not be available until the transition is complete. We apologize for any inconvenience this may cause you.
Radiometric Correction of Satellite Images 21 January 2016
The Radiometric Correction process in TNTmips (Image / Radiometric Correction) calibrates images acquired by satellite optical sensors to radiance or reflectance values. These corrections allow more accurate assessment of ground surface properties and facilitate comparison between images acquired at different times or for different areas.
Release of TNTgis 2016 13 January 2016
The 2016 Release Version of the TNTgis software family (TNTmips, TNTedit, and TNTview) is now available.
This release includes new processes, updated processes, and many new features.
New Feature Highlights
Download the new Release Version today!
Automatic Image Georeferencing 6 January 2016
The Auto-Register operation in the Georeference process (TNTmips and TNTedit) can now automatically georeference geolocated aerial images with unknown orientations using a reference image. Geolocated images have map coordinates for only a single point (such as a GPS camera position recorded in EXIF metadata, nominally the image center). The Automatic method in Auto-Register uses keypoint matching to establish the image orientation relative to the reference (if necessary), then uses image cross-correlation to find additional control points. A new separate process to perform auto-registration on large sets of aerial images is also now available (Image / Auto-Register to Reference Image).
Auto-Register to Reference Image
Keypoint Matching for Image Registration
Batch Automatic Image Georeferencing
Spatial Display: Vector and Shape Layer Controls 16 December 2015
Layer controls dialogs provide access to display settings for specific types of layers. Open the Vector Layer Controls window by left-clicking
on the vector layer's icon button in the Display Manager or by right-clicking on the
layer name and choosing Controls from the popup menu. Shape Layer Controls are opened the same way for shape layers.
The layer controls are organized in a set of tabbed panels. The Object panel
provides settings that pertain to the entire layer. A tabbed panel for each of the vector element types: Points, Lines, Polygons, Nodes, and
Labels in Vector Layer Controls lets you set element specific controls to show and style elements, set datatips and dynamic labels, and label legend samples. The Shape Layer Controls dialog has an Elements tabbed panel with similar controls.
Spatial Display: Render to PDF 9 December 2015
The Render to PDF operation in TNTmips and TNTedit allows you to render the contents of the View window to a PDF file. The operation can render layers in simple groups or complex map layouts, including raster and geometric layers, WMS and ArcIMS layers, map grids, legends and scale bars, and text. Complex line and point symbols, including those created by CartoScripts, can be reproduced faithfully in the PDF file. Georeference information is automatically transferred, producing a Geospatial PDF file that can be used with the analysis tools in Adobe Reader to get coordinate readouts and make measurements. You also have the option to include layer controls in the PDF file so that any individual layer can be turned on or off in Adobe Reader. To use the Render to PDF operation, choose Display / Render to / PDF from the Display Manager.
UPDATED DataTip Technical Guides 3 December 2015
DataTips are provided in TNTgis to show selected attribute information for spatial layers under or near the screen cursor when it is paused in the View window. DataTips can show the cell value from a raster layer, database attributes for elements in geometric objects (vector, CAD, shape, Lidar, and TIN) and database pinmaps, and image thumbnails from a geotagged image database table. When you are displaying geometric data layers, you can choose to have the associated elements automatically highlighted in color when the DataTip is shown.